
One of the most common types of assessment at university is the report. Your lecturers assign report tasks to prepare you for life after graduation when your professional communication skills will be invaluable. This page will help you to meet your lecturers' expectations by:
- self-evaluating your current strengths and weaknesses
- considering the difference between essays and reports
- considering audience and purpose to make effective content and language choices
- structuring your reports appropriately
- reviewing language to describe graphics and analyse data in your reports.
Download this summary sheet for your own reference.
Introduction to report writing
This section will introduce you to the common features of reports.
Self-evaluation
Before you continue, reflect on your previous writing experiences and the feedback you have received. How would you rate your ability in the following skills? Rate your ability from ‘good’ to ‘needs development’.
Reflect on your answers. Congratulations if you feel confident about your skills. You may find it helpful to review the materials on this page to confirm your knowledge and possibly learn more. Don't worry if your skills need development. All students must learn academic skills and these materials will help you.
An overview of reports
Watch this video to learn more about report writing.
- Task: Assessment of report writing. What have you learned from the video? Decide if these statements about reports are true or false.
Reports vs essays
Essays and reports have several differences. Understanding the differences will help you to avoid confusion when you have an assessment task to complete.
Remember: some disciplines sometimes follow different writing conventions. For instance, Law and Environmental Science often use headings in essays although most disciplines rarely do. The following task reviews what is mostly true about essays and reports. You need to read examples from your discipline to check for differences.
Read these writing features and drag them to the most appropriate column on the table. Is each feature:
- mostly true of essays
- mostly true of reports
- equally true of both essays and reports.
Over to you
Stop and reflect on what you’ve just learned.
Write down three things you want to remember.
Read the instructions in your assessment tasks to ensure you know what your lecturer requires.
Reports in the disciplines
Most reports are similar in that they are often descriptive documents rather than argumentative like essays. However, their layout can vary substantially, depending on the discipline. The following is a brief overview of four common types of report that you may encounter as a student.
Business reports
Business reports vary in content and format. You may write reports such as case studies, progress reports, market research reports, or financial reports. However, they all share a similar purpose: they are written in the professions to make useful information available to managers, stakeholders, and decision makers.
Laboratory reports
Laboratory reports are a common type of assessment in the STEM disciplines. Their content and format often follow a common pattern: introduction, method, results, discussion. The purpose is for students to share the results of small-scale experiments or investigations conducted as part of their learning.
Research reports
The purpose of a research report is to provide an account of your original research. This might be:
quantitative research involving numerical data that is produced in an experiment, observation or field study
qualitative research involving data based on interviews, focus group findings, archival materials, or library data-base research
a combination of the two.
The longest research report you may write at university is your thesis. If you are a research student, you can learn more about research reports in the Study Skills pages on Research Communication.
Technical reports
Technical reports are common in the Engineering and IT disciplines. After you graduate, you may need to write technical reports in your workplace to help your managers with decision making. One common purpose is to present a solution to a technical problem and to recommend action.
Over to you
Reflect on the reports you need to write this semester. What type of reports are they? Read the instructions carefully and ensure you understand the purpose of each.
Report Format
Most reports contain three major elements: preliminary matter, the body of the report, and end matter. The content of these three elements may vary, so you must pay close attention to the instructions for your task.
- All reports use headings and sub-headings. Your lecturer may expect a specific report format with set headings and sub-headings; however, some may expect you to write your own headings. Visit the Cohesion page to learn more about writing effective headings.
- After you graduate, your future employers may require you to use a specific report structure and layout with set headings.
This section gives a general overview of the more common content and headings for each section of reports.
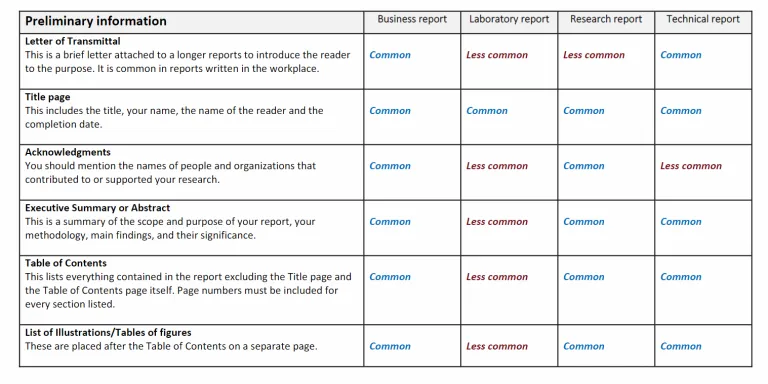
Preliminary information
The following table gives an overview of common content in preliminary matter.
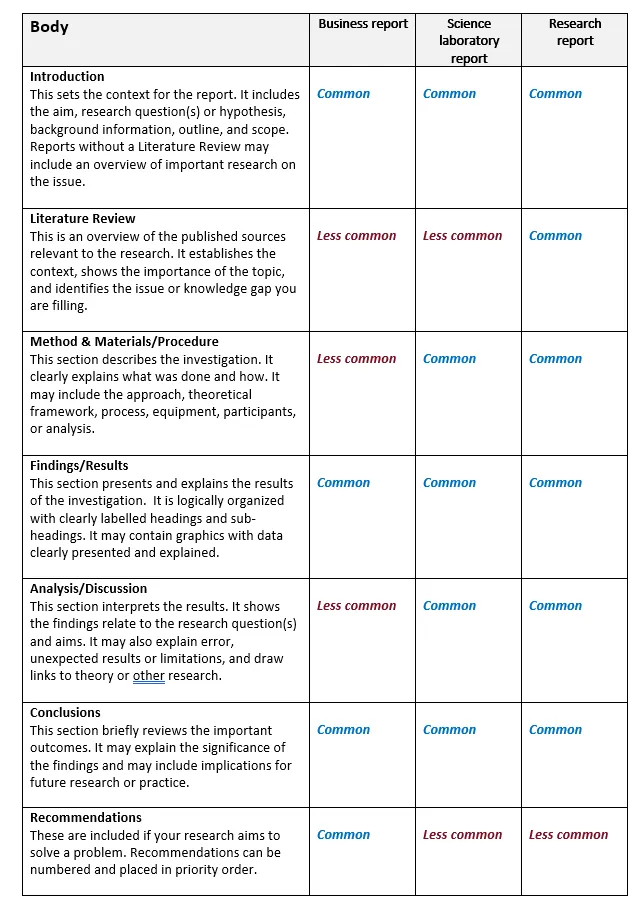
The body
The following table gives an overview of common content in the body.
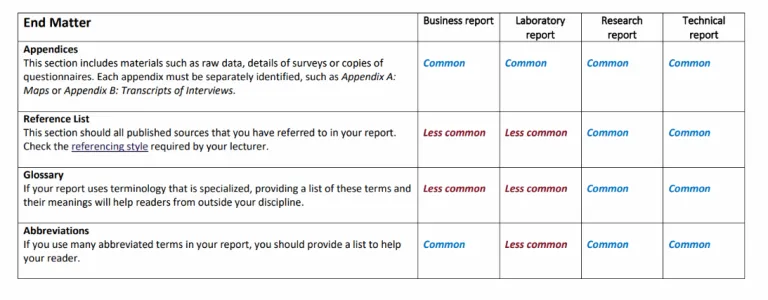
End matter
The following table gives an overview of common content in the end matter.
Report format: a recap
Download this PDF document Report Structure Overview and put it above your desk as a handy reference.
Over to you
Think about the reports you need to write for your units. What do you know about the expected formats?
Go to your units on Learnline and carefully read the instructions for a report you need to write. Check whether your lecturer has provided a template or guidelines. If not, ask them what they expect.
Report images in the Report Format section were taken from:
Annual Report 2022-23. (2023). Services Australia. https://www.servicesaustralia.gov.au/annual-reports?context=1
Australian universities accord interim report. (2023). Department of Education, Australian government. https://www.education.gov.au/australian-universities-accord/resources/accord-interim-report
Charles Darwin University Annual Report. 2022 year in review. (2023). Charles Darwin University. https://www.cdu.edu.au/media-communications/annual-reports
Dutta, S., Lanvin, B., Leon, L. R., & Wunsch-Vincent, S. (2022). Global innovation index 2022 – Which are the most innovative countries. World Intellectual Property Organization. https://www.wipo.int/global_innovation_index/en/2022/index.html
Luck, J. (2021). Bond strength of FRP confined sea water seasand concrete tubes under cyclic load [Unpublished master's thesis]. Charles Darwin University.
Martinez Claro, P. A. (2021). Using isotopic tracers to estimate groundwater flowpaths and residence times in the Ranger Uranium Mine lease area [Unpublished master's thesis]. Charles Darwin University.
Treasury annual report 2022-23. (2023). The Treasury, Australian Government. https://treasury.gov.au/publication/p2023-454036
Western Australia Biosecurity Strategy 2016-2025. (n.d.). Department of Primary Industries and Reginal development, Western Australia. https://www.agric.wa.gov.au/sites/gateway/files/WA%20Biosecurity%20Strategy%20%28A1756933%29.pdf
Audience and purpose
When writing a report, you should think carefully about your readers and the purpose of your report. This will help you decide what content to include, what language to use, and how you format your report.
Considering your reader: language choices
You will spend many years studying your discipline at university. During this time, you will learn technical or discipline-specific vocabulary (words). After you graduate, you may start using professional jargon with your colleagues.
Jargon should always be avoiding in report writing. Technical or discipline-specific vocabulary should be avoided if your readers don't share your educational background. Ask yourself these questions:
What is my report trying to achieve?
What knowledge or education does my reader have in my field?
What word choices will my reader most easily understand?
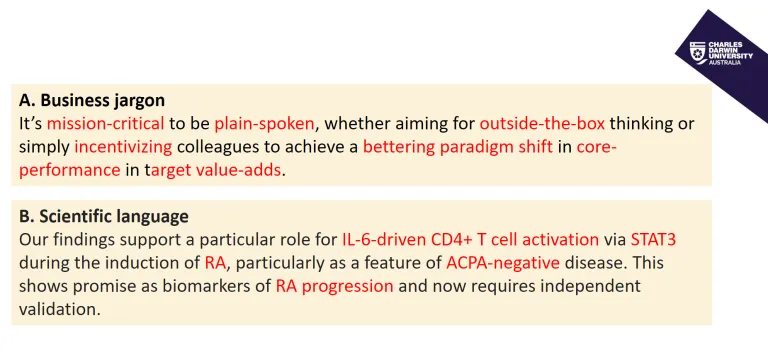
Imagine you are a medical professional writing a report for a manager with a business background. Which report extract would be most helpful?
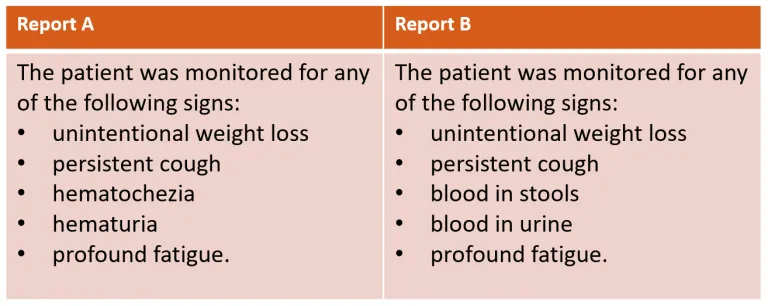
If you chose B, you probably recognised that hematochezia and hematuria are probably not easily understandable for a reader without medical knowledge.
If you must use technical words in your report, you should provide a glossary in the end matter for your reader.
Considering your reader: content and format
As with language, you need to consider your reader when you choose content and format for your report. Ask yourself these questions:
- What is my report trying to achieve?
- What does my reader already know?
- What does my reader need to know?
- How can I help my reader?
The answers to these questions will help you make decisions about layout and content to ensure that your key message is accessible and clear.
- Task: Considering your reader. Consider the needs of the reader in each of the following situations and decide which report element is LEAST useful for them.
Over to you
- Read a report draft you are currently writing for one of your units.
- Have you considered the needs of your reader?
- What could you change to help them understand your message?
Writing about data in reports
Graphics may include technical diagrams, illustrations or data presented in graphs and tables. They can convey complex information, demonstrate relationships, illustrate trends, and classify data. They can also clarify technical ideas and help to emphasise important points.
If you include graphics in your writing, it is important that you incorporate them appropriately.
Test your knowledge
Work through the rest of this material to practise integrating data and graphics into your writing.
Incorporating graphics into your text
When you use graphics in your reports, you must:
- decide what type of graphic will best convey the information you want to share
- synthesise the graphic into your text so your reader understands your point.
You can do this in three steps:
- direct your readers’ attention to the graphic
- highlight the important data in the graphic
- comment on the important data: explain it, interpret the significance, and/or link it to other data or research.
We will now look at an example.
Consider these questions:
- What is the purpose of report titles?
- Are report titles usually sentences or phrases?
- What do you think makes a report title effective?
Examine this table which presents data from a small study that analysed report titles. Which results seem significant?
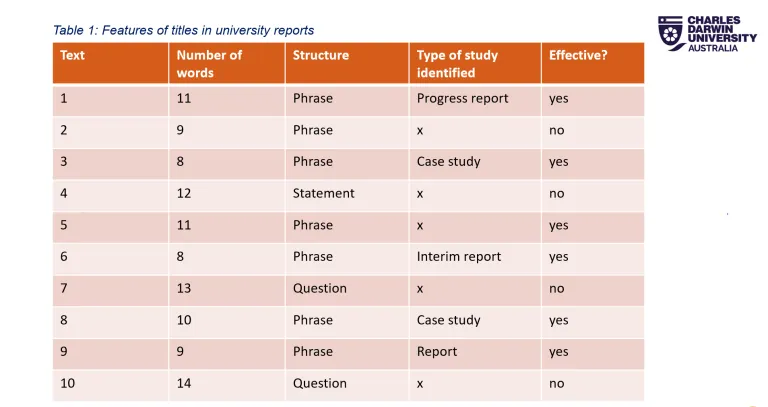
Read this paragraph which is taken from a report on student writing. The paragraph explains Table 1 for the reader. Consider:
- How does the writer structure their commentary?
- What is the function of the language in blue?
- Task: Understanding Data commentary. Click on the hotspots to confirm your thoughts.
To recap, when you incorporate graphics into your report, you should:
- direct your readers’ attention to the graphic
- highlight the important data in the graphic
- comment on the important data: explain it, interpret the significance, and/or link it to other data or research.
- Task: Engineering paragraph sequencing. Using what you have learned, put the following paragraph from an Engineering report into order. Hint: look for a topic sentence to begin the paragraph.
Focus on language: data commentaries
You can incorporate your data commentaries more seamlessly into your report if you use clear signpost language to guide your reader. To develop your language, you could:
pay close attention to how writers in your discipline incorporate data into in published reports
use a site such as the Manchester Phrase Bank, which is one useful source of language to help you express yourself.
Drawing your readers' attention to your graphic
| Table 1 Figure 1 | shows compares presents provides | an overview of … the experimental data on X. the summary statistics for … the results obtained from the preliminary analysis of X. |
| The results of the correlational analysis The themes identified in these responses The data obtained from X | are shown are set out are presented are summarised | in Table 1. in Figure 1. |
| Health outcomes improved The population fell | as can be seen as illustrated | in Table 1. in Figure 1. |
Highlighting important data in your graphic
| The second pie chart in Figure 2 The top half of the table above The last row of Table 10 | identifies pinpoints highlights | the breakdown of... |
What stands out in | Figure 6 | are X and Y. is that the highest demand is... |
Commenting on important data in your graphic
A possible explanation for this might be that …
This result may be accounted for by the fact that …
These relationships may partly be explained by …
This inconsistency may be due to …
These results are likely to be related to …
This discrepancy could be attributed to …
Download the Useful Data Commentary Language document and use it as a guide when you are writing.
You will need this language when you do the tasks in Focus on language: numbers and comparisions and Focus on language: describing trends and change
Focus on language: numbers and comparisions
When we describe data, we need to be able to talk about numbers, fractions and percentages and we need to be able to compare them.
- Consider the most significant data and how it may be compared and explained.
- Read the data commentary
- Fill the gaps with the most appropriate language. You can refer to the language in Focus on language: data commentaries and in the tables below to help you.
Describing numbers
| Number | Most... The most... The majority of ... The greatest number of ... | The least... A minority of ... The least number of ... |
| Percentage | A high percentage of ... A higher percentage of ... | A low percentage of ... A lower percentage of ... |
| Fractions | The greatest part... | The smallest part... |
Sometimes we need to talk about changes in numbers, fractions and percentages. For example:
- The number went up by 600, from 1200 to 1800. (Number)
- The number went up by half, from 1200 to 1800. (Fraction)
- The number went up by 50%, from 1200 to 1800. (Percentage)
- The number went up 150%, to 1800. (Percentage)
Use "trebled," "-fold," and "times:"
- The number doubled between 2002 and 2004.
- The number trebled between 2004 and 2006.
- There was a twofold increase between 2002 and 2004.
- The number went up sixfold between 2002 and 2006.
- The figure in 2006 was six times the 2002 figure.
- The figure in 2008 was four times the 2006 figure.
Use Fractions:
- Between 2002 and 2004, the figure fell by one-fifth.
- Between 2004 and 2006, the number dropped by a half.
Prepositions
| on average | an average of x | 20% of X |
| between X and Y | at a level/rate/speed of | increase from x to y |
| increase by X% | increase to X | peak at X |
Making comparisons
| Words and phrases for comparing | |
|---|---|
| Compared to X, ………. Compared with Y, ……… | In comparison, X is … In contrast, Y is … |
| X is _____- er than Y (higher than, stronger than) X is not as ______ as Y (high, strong) | X is more _______ than Y (significant, expensive) X is less _______ than Y (significant, strong) |
| In comparison with X, ….. In comparison to X, ….. In contrast to X, Y is... On the other hand, … | X is similar/different to Y in that … X differs from Y in that … X is …. whereas/while Y is …. |
| In the same way, …. Equally, …. Similarly, …. | Both X and Y are... |
Focus on language: describing trends and change
When we describe trends and change, we need to use:
- nouns and verbs that express movement (progression, progress)
- adjectives and adverbs that describe that movement (quick, quickly).
- Consider the most significant changes and how they may be explained.
- Read the data commentary.
- Fill the gaps with the most appropriate language. You can refer to the language in Focus on language: data commentaries and in the tables below to help you.
Useful expressions which will help you to describe change
Movement down
Strong words
| Movement down
| Movement up
Strong words
| Movement up
|
No movement
Changing movement
| Reached the highest point or lowest point
| ||
Adjectives
| Adverbs
| ||
Prepositions: Time Expressions: Past
| Time expressions: Future By 2030, it is expected to have reached ... By 2030, the total is projected to be ... | ||
Report writing and Generative AI
Using generative AI (GenAI) ethically for report writing in university is important for keeping academic honesty and originality. While GenAI can help with brainstorming ideas, creating outlines, and improving writing, students must make sure the work they submit is truly their own. Relying too much on AI-generated content can hurt the learning process and break academic honesty rules.
The limitations of Gen AI for report writing
Generative AI (GenAI) has several limitations when it comes to report writing. It often lacks a deep understanding of topics, which can lead to problems with originality and plagiarism, and it cannot collect new data. Relying too much on AI raises ethical concerns and can undermine academic integrity. The quality of AI-generated text can vary, and it may repeat biases found in its training data. Furthermore, GenAI lacks true creativity, producing content that is coherent but not truly original. Using it too much can also prevent students from developing their own writing and critical thinking skills.
- Task one: Analysis AI prompt. Have a look at the report task and answer the questions.
- Task two: Examine a sample rubric. Consider what is most important in report writing and answer the questions.
- Task three: Understanding GenAI strengths and limitations. GenAI can be useful in parts of the process, but it cannot assist in many important aspects. Let’s look at its strengths and limitations. Answer the questions.
- Task four: GenAI text analysis. Read a sample of GenAI text, and consider how well it addresses the criteria in the rubric. Then compare it with a sample of human text.
Prompts to help you get started with your report
Prompt engineering is a pivotal skill in leveraging AI effectively for academic and professional purposes. Clear and specific prompts, such as those focusing on outlines or research plans rather than final products, foster deeper engagement with the subject matter and uphold academic integrity.
- Task: Prompts analysis. See some prompts to help you get started with your next report.
We also encourage you to review our study skills page “Using AI tools at university” and download the GenAI Quick Tips sheet to learn more about how to use GenAI effectively and ethically.
Applying your learning
Reflect on what you have learned in this material and consider how you can use it in your own work.
Useful strategies
1 | Read a published report from your discipline.
|
2. | Exchange a draft report with a peer and give each other feedback.
|
3 | Be very careful with referencing. The referencing style that you use depends on the expectations of your lecturer, so always check first. |
Next steps
Reflect on your learning
- Revisit the self-analysis quiz at the top of the page. How would you rate your skills now?
- Remember that writing is a process and mistakes aren't a bad thing. They are a normal part of learning and can help you to improve.
If you would like more support, visit the Language and Learning Advisors page.
Did you know CDU Language and Learning Advisors offer a range of study support options?
https://www.cdu.edu.au/library/language-and-learning-support